Grafana Tile
About
This Tile displays data collected by your Devices using Grafana.
This is typically used for Condition Monitoring. You are able to display data
of machines using the various visualization styles that Grafana provides.
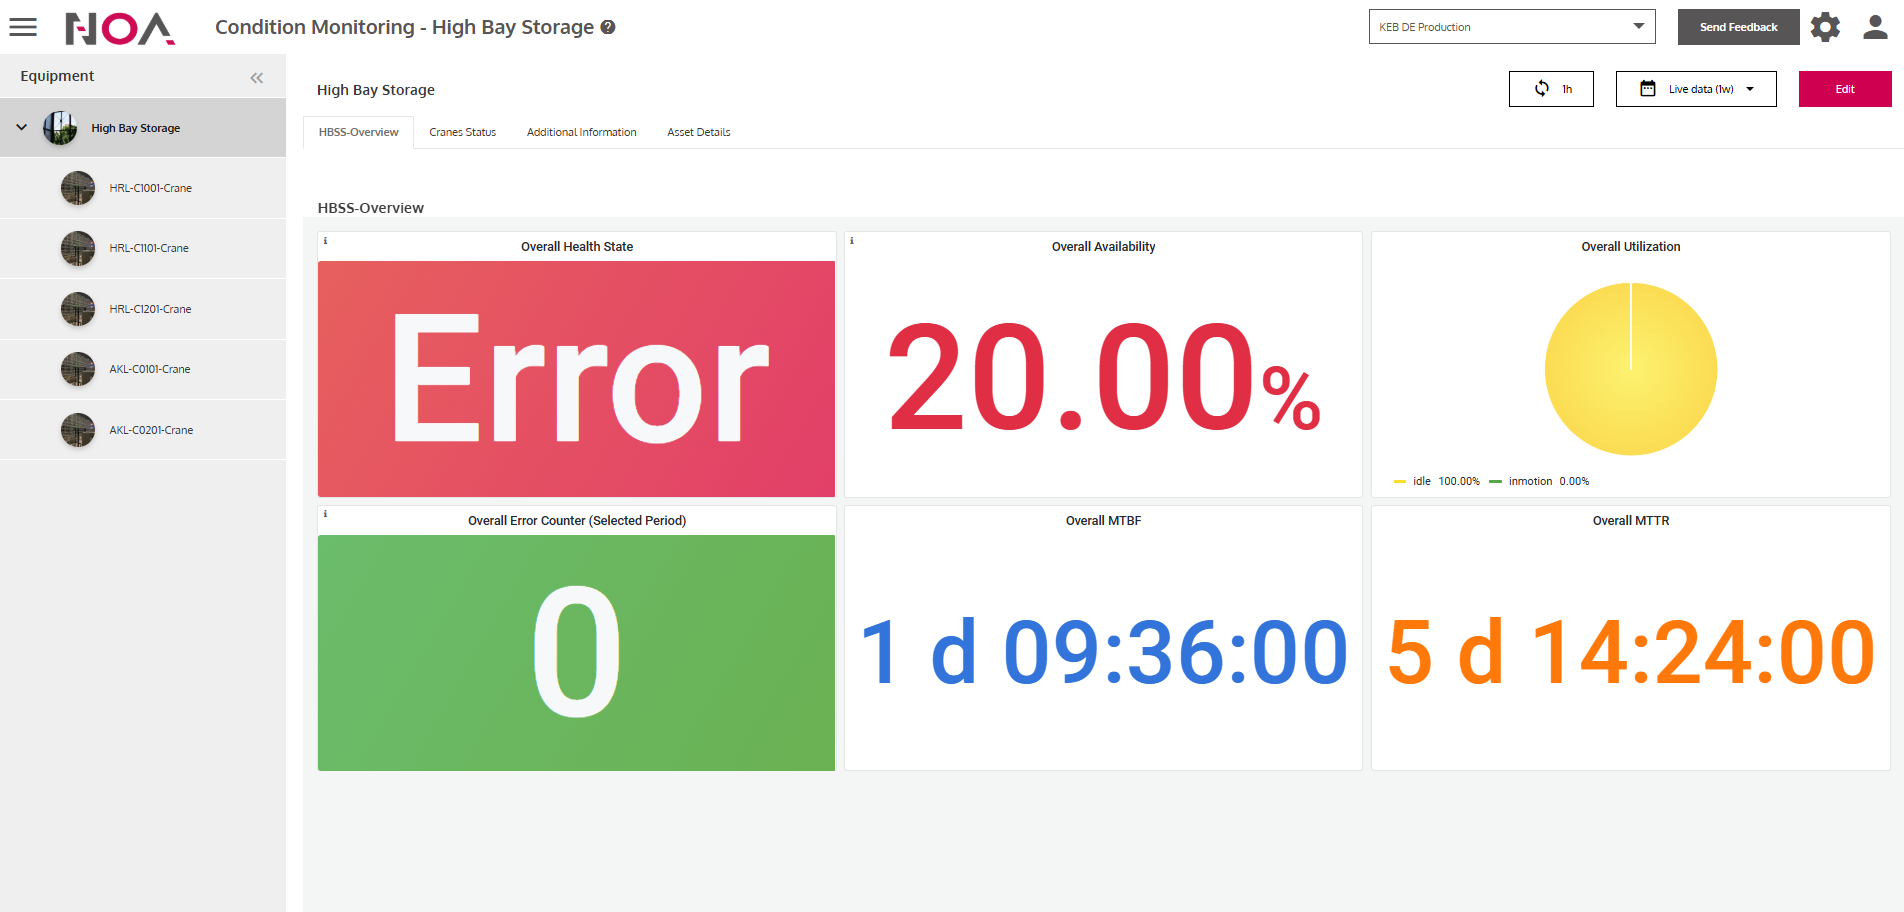
Below is an example Grafana Dashboard of the KEB High Bay Storage.
Example
Edit Grafana Tile
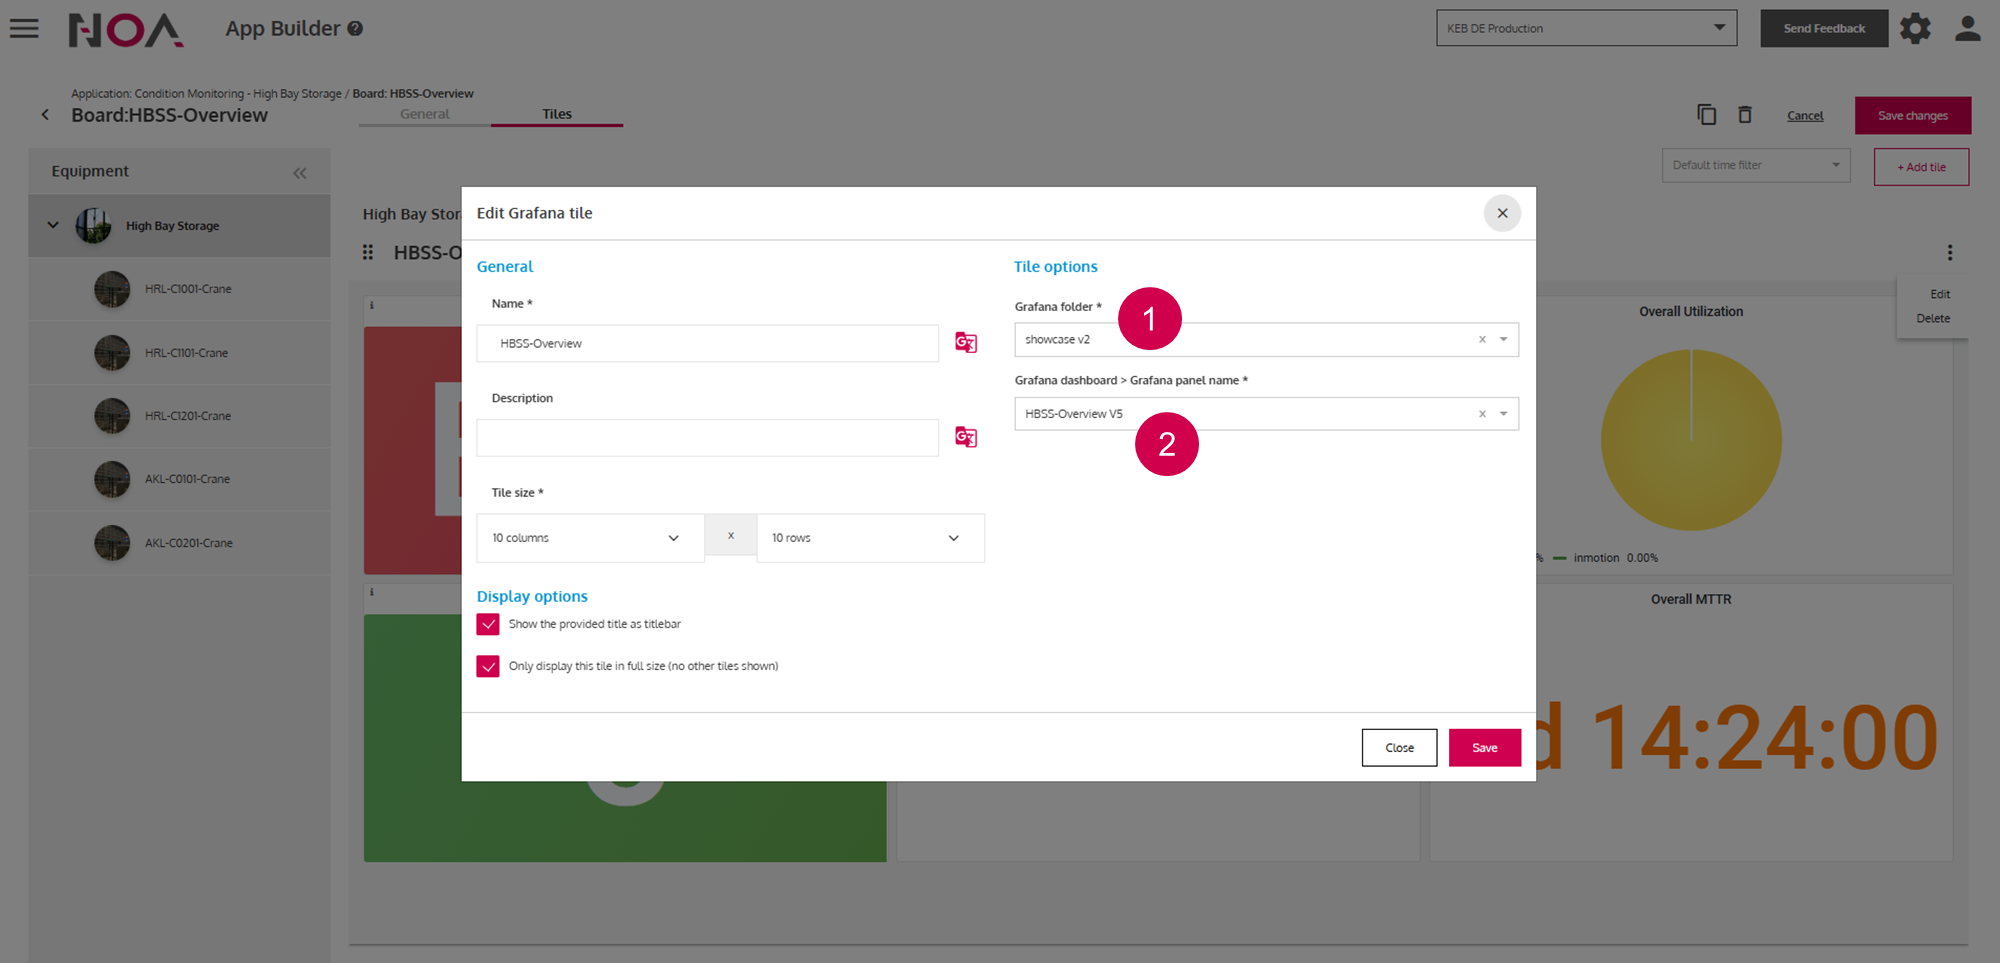
Choose the
Devicethat you want to display data for in theGrafanafolder.Choose a
Grafanadashboardof that device. See Device Management for more information about automatic generatingGrafanapanels.
Please visit the Data Analytics
section for a brief guide to customize your Grafana panels. If you want a
detailed instruction of Grafana, then please
visit their Documentation.