Condition Monitoring
Follow the instructions below to set up local Condition Monitoring.
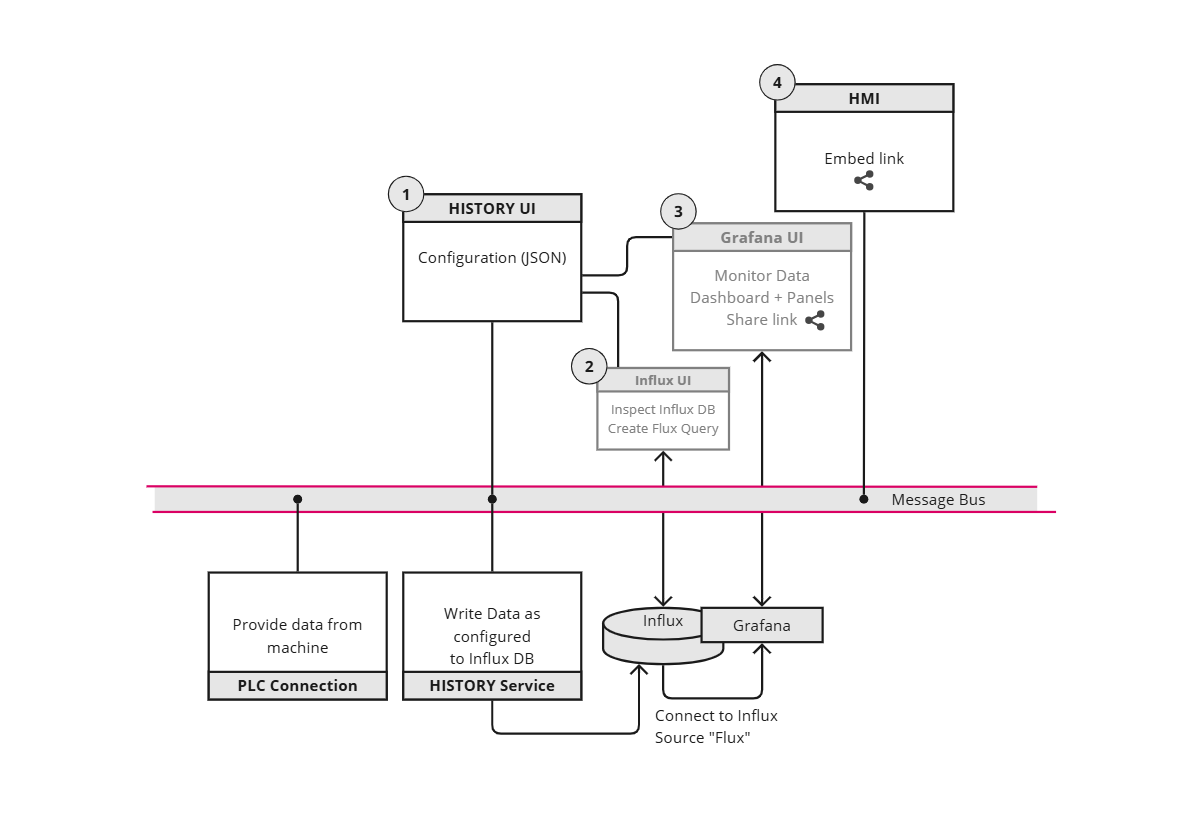
- Configure Data Collection
- Configure Influx Database
- Build Dashboard in Grafana
- Embed in HMI
Open Source Tools
- Influx Time series database: (
admin/password) - Grafana for Dashboards and Data visualization (
admin/admin)
Settings
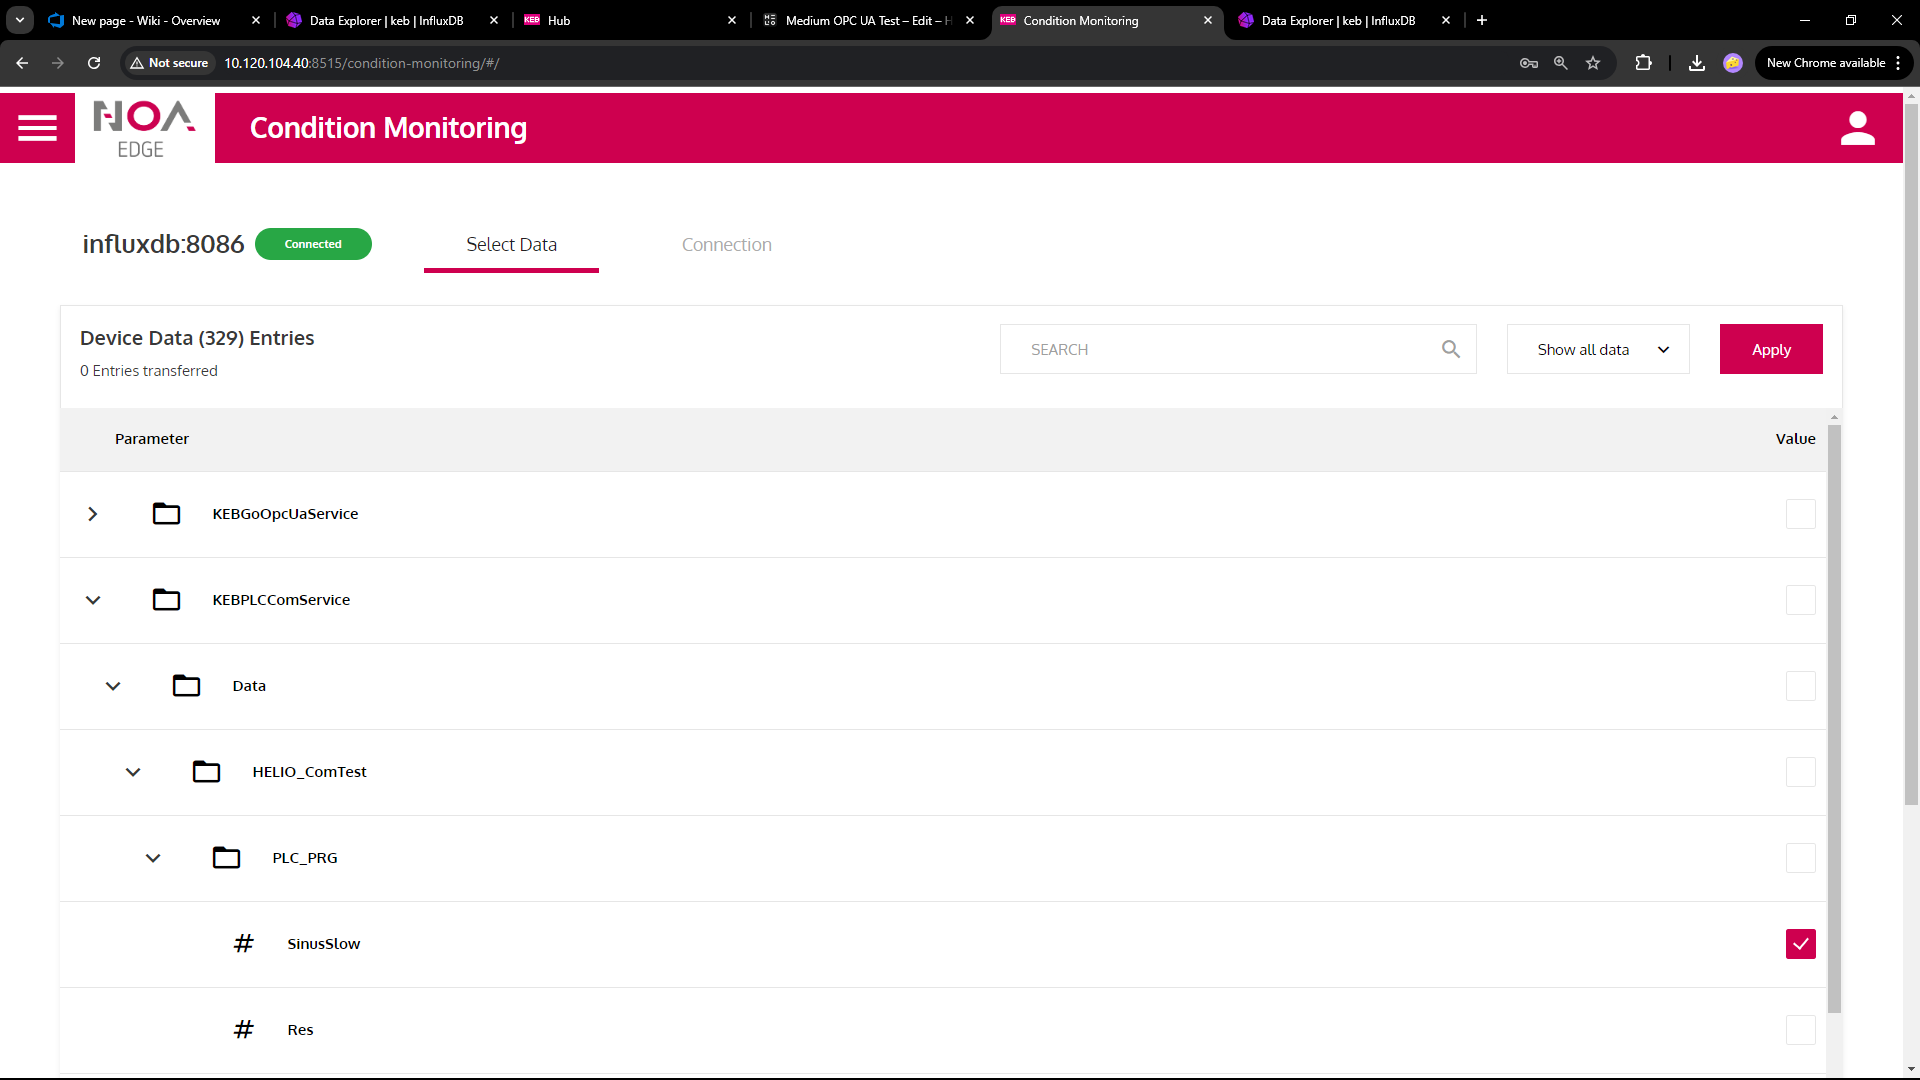
Select Data
Specify the data that shall be written to the Influx database.
Select the data that should be written from Parameter tree.
- If no data is shown: check your [Device Communication -- /NOA-Documentation/Device-Communication) and the
- Influx Connection setting (see next step)
Configure Influx
If needed: Re-configure the database connection to Influx

- IP Address of local Influx is
influxdb, remote DB e.g.10.120.104.50works, too (localhostwon't work) - Defaults: Port
8086, Bucketkeb_drive_data - Authentification
kebandmy-token(see below)
Influx Configuration
Influx is used as a database to store the time series data that is configured for the Condition Monitoring app (Influx Writer).
- Access the Influx Webapp
- Use port 8086 i.e.
http://<ip>:8086 - Use
adminandpasswordfor authentication
- Use port 8086 i.e.
Data Explorer
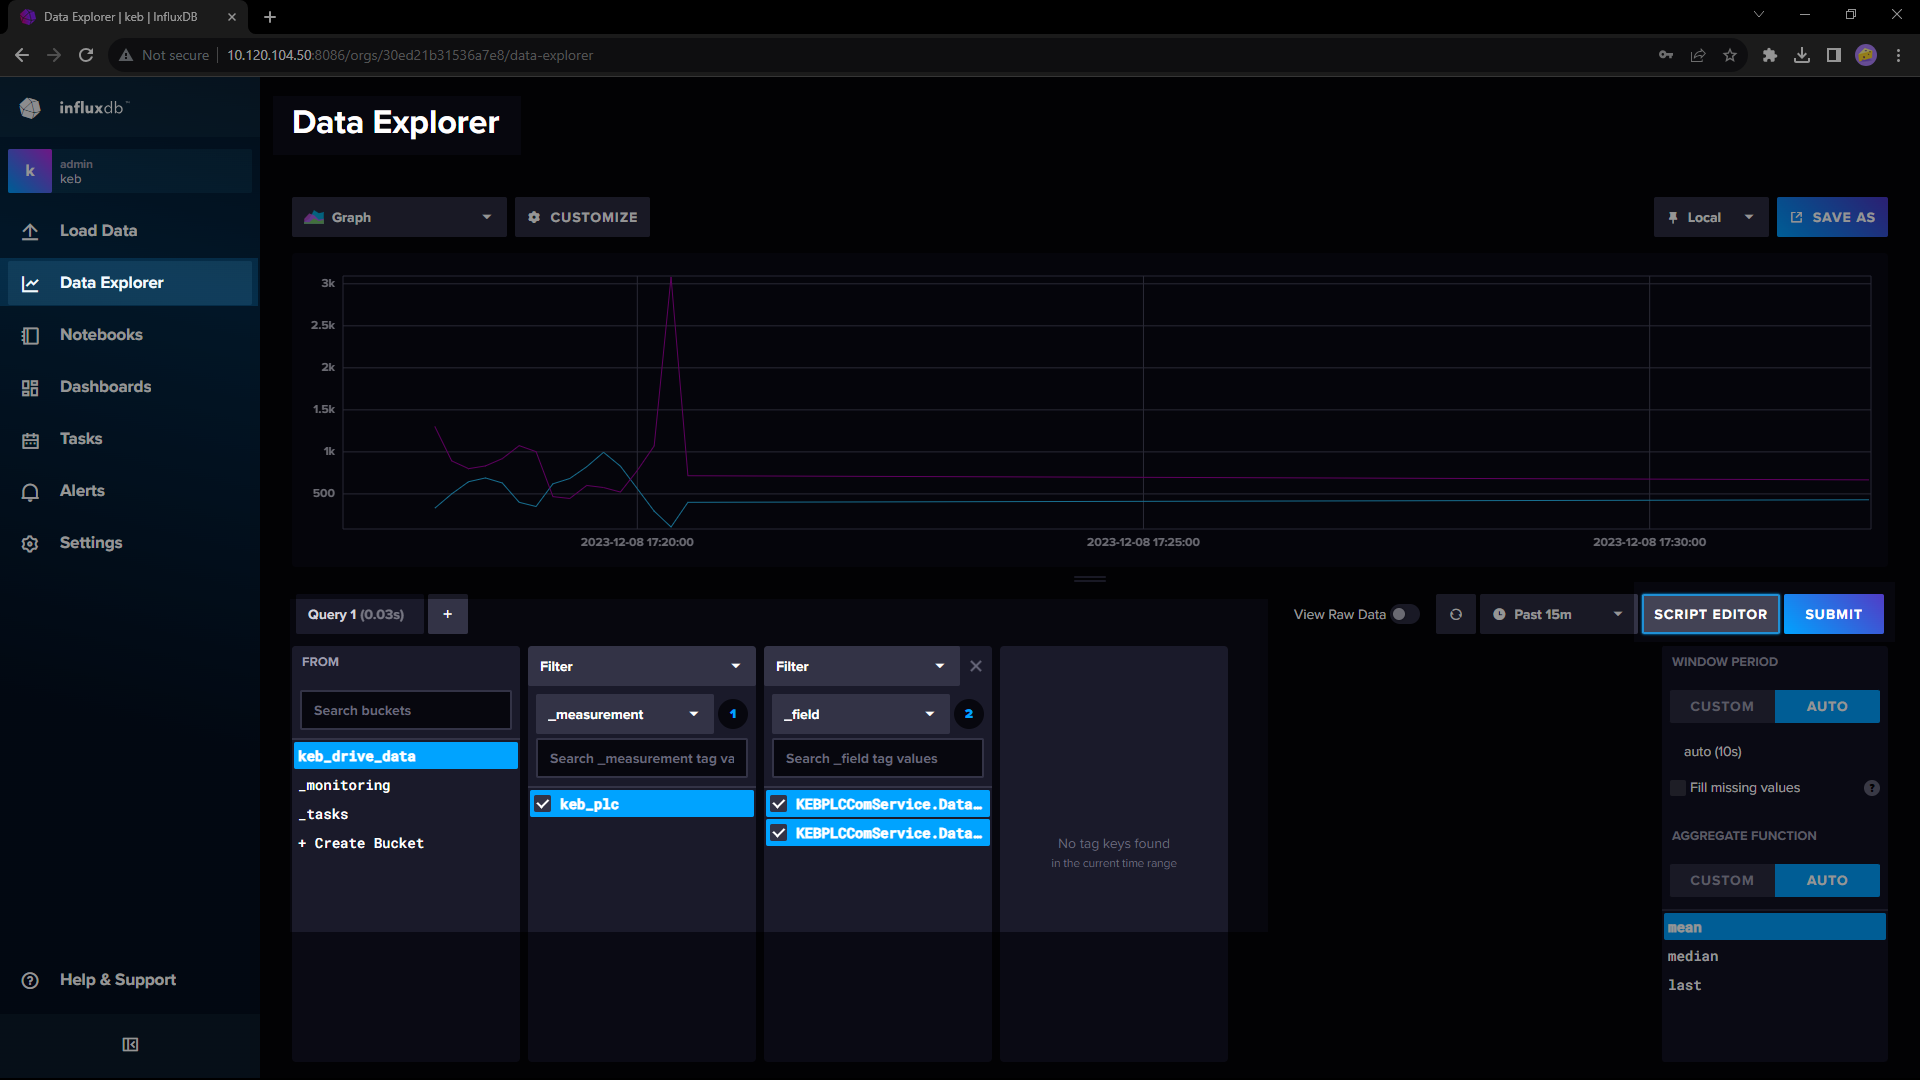
- Choose "Data Explorer" in the menu on the left
- Select the data to show below "Query1"
- Press "Submit" to see the result
- Modify Window Period to "CUSTOM" and set to
1s, Aggregate Function to "CUSTOM" and de-select "mean" - This shows a simple graph of the selected data.
⚠ Make sure the time frame is set correctly e.g. "Past 15m" and that there is data actually available.
Check for data in the "future" (time not set correctly on device), use now-1d to now+1d to make sure
➡ (Time Settings -- /NOA-Documentation/NOA-Hardware/Time-Settings)
Script Editor
Switch to "Script Editor"
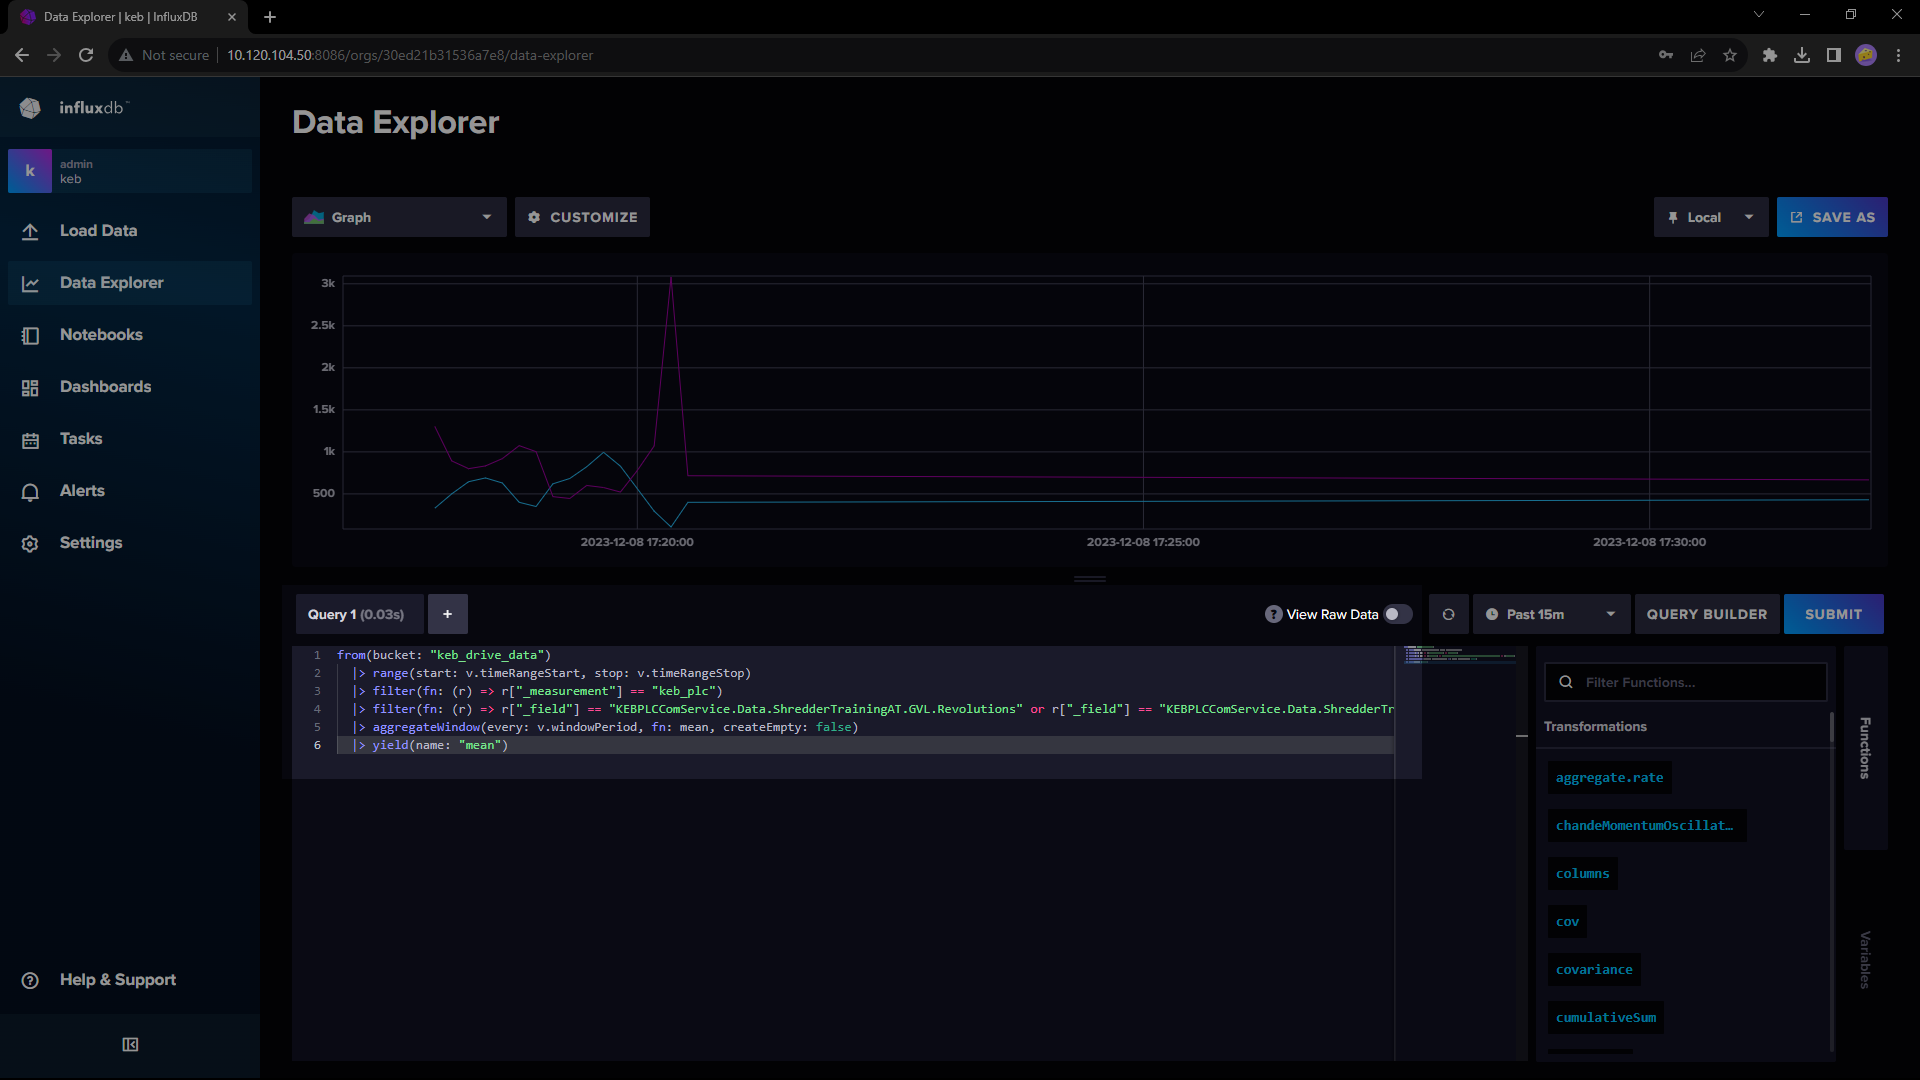
- The query "Query1" is shown as plain text
- Copy this text to the Clipboard (mark and Ctrl-C) -- insert this query into Grafana (next section)
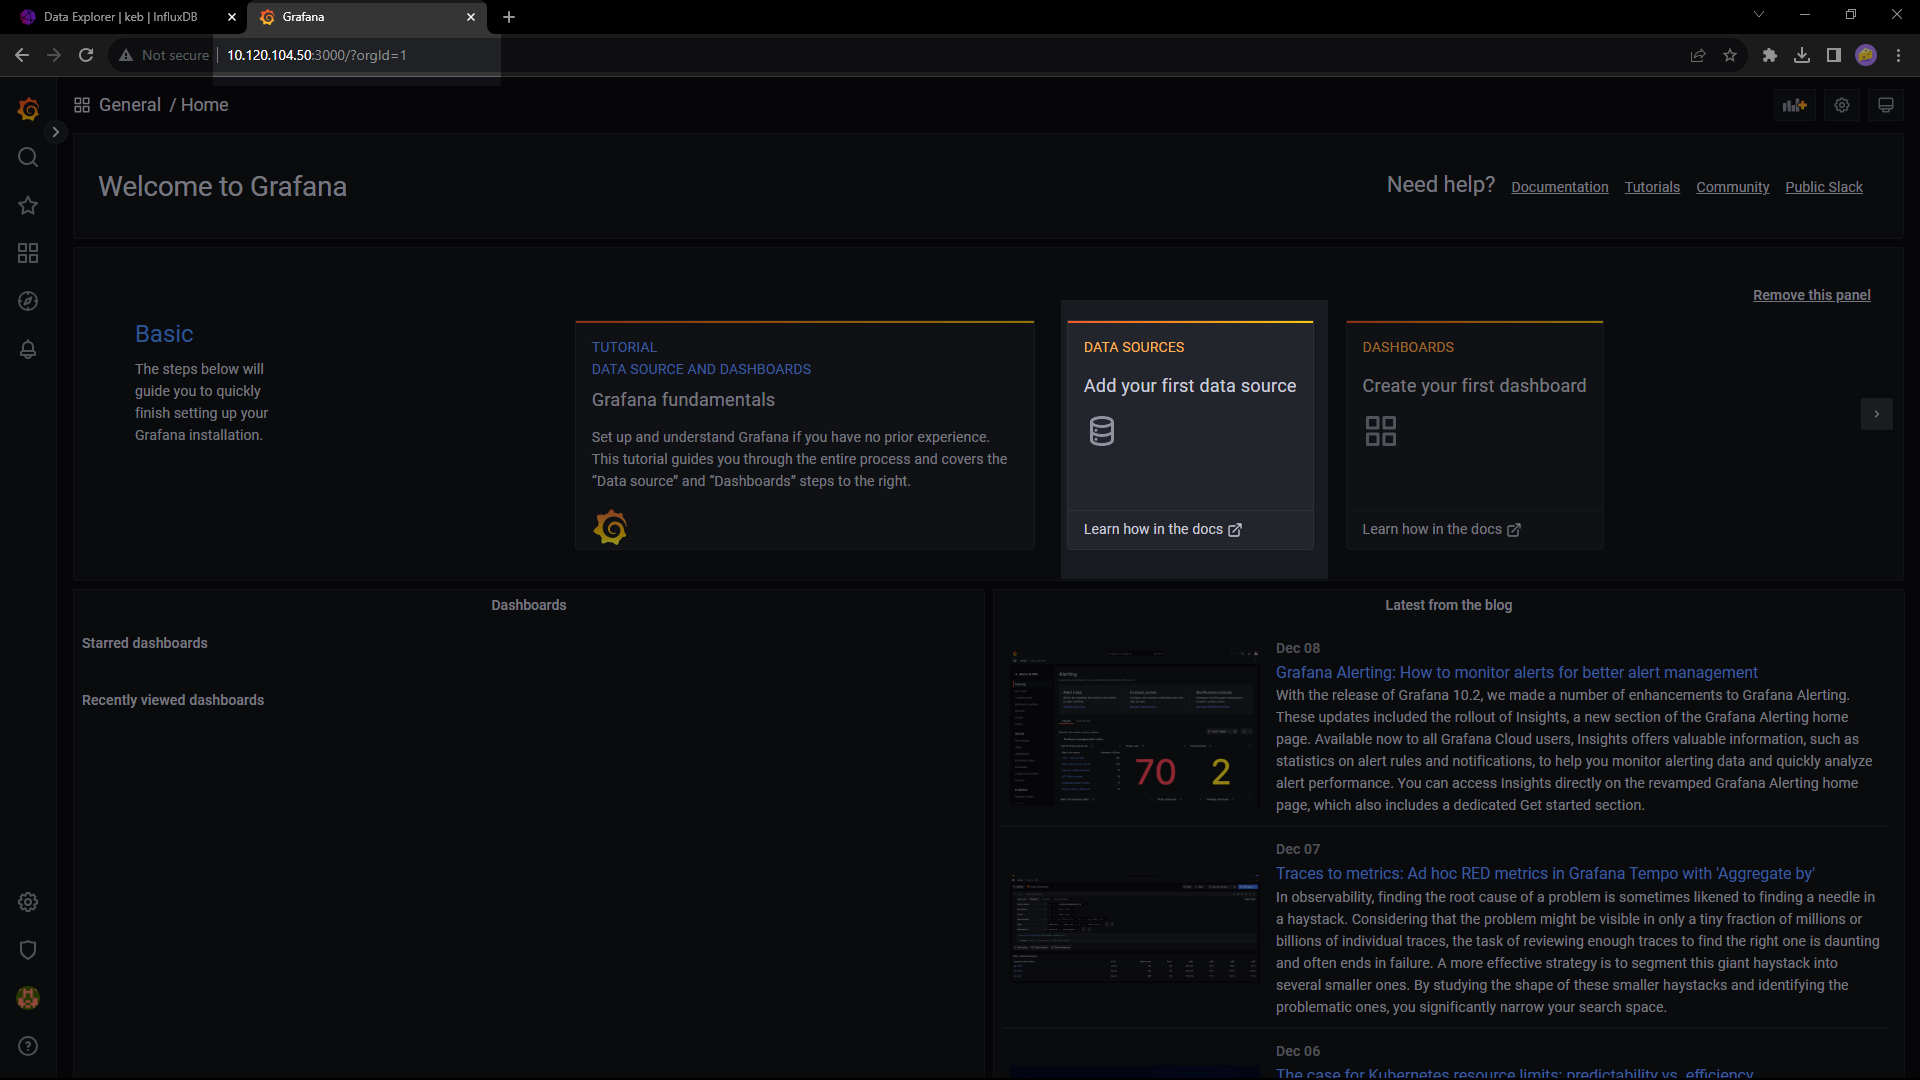
Grafana Configuration
Grafana is used to visualise and analyse data from any source, in this case an Influx database.
- Access the Grafana Webapp
- Use port 3000 i.e.
http://<ip>:3000 - Use
adminandadminfor authentication (Choose "skip" if you don't want to alter the credentials)
- Use port 3000 i.e.
Create Data Source
- Click "Add your first data source"
- Select "InfluxDB" in the following screen
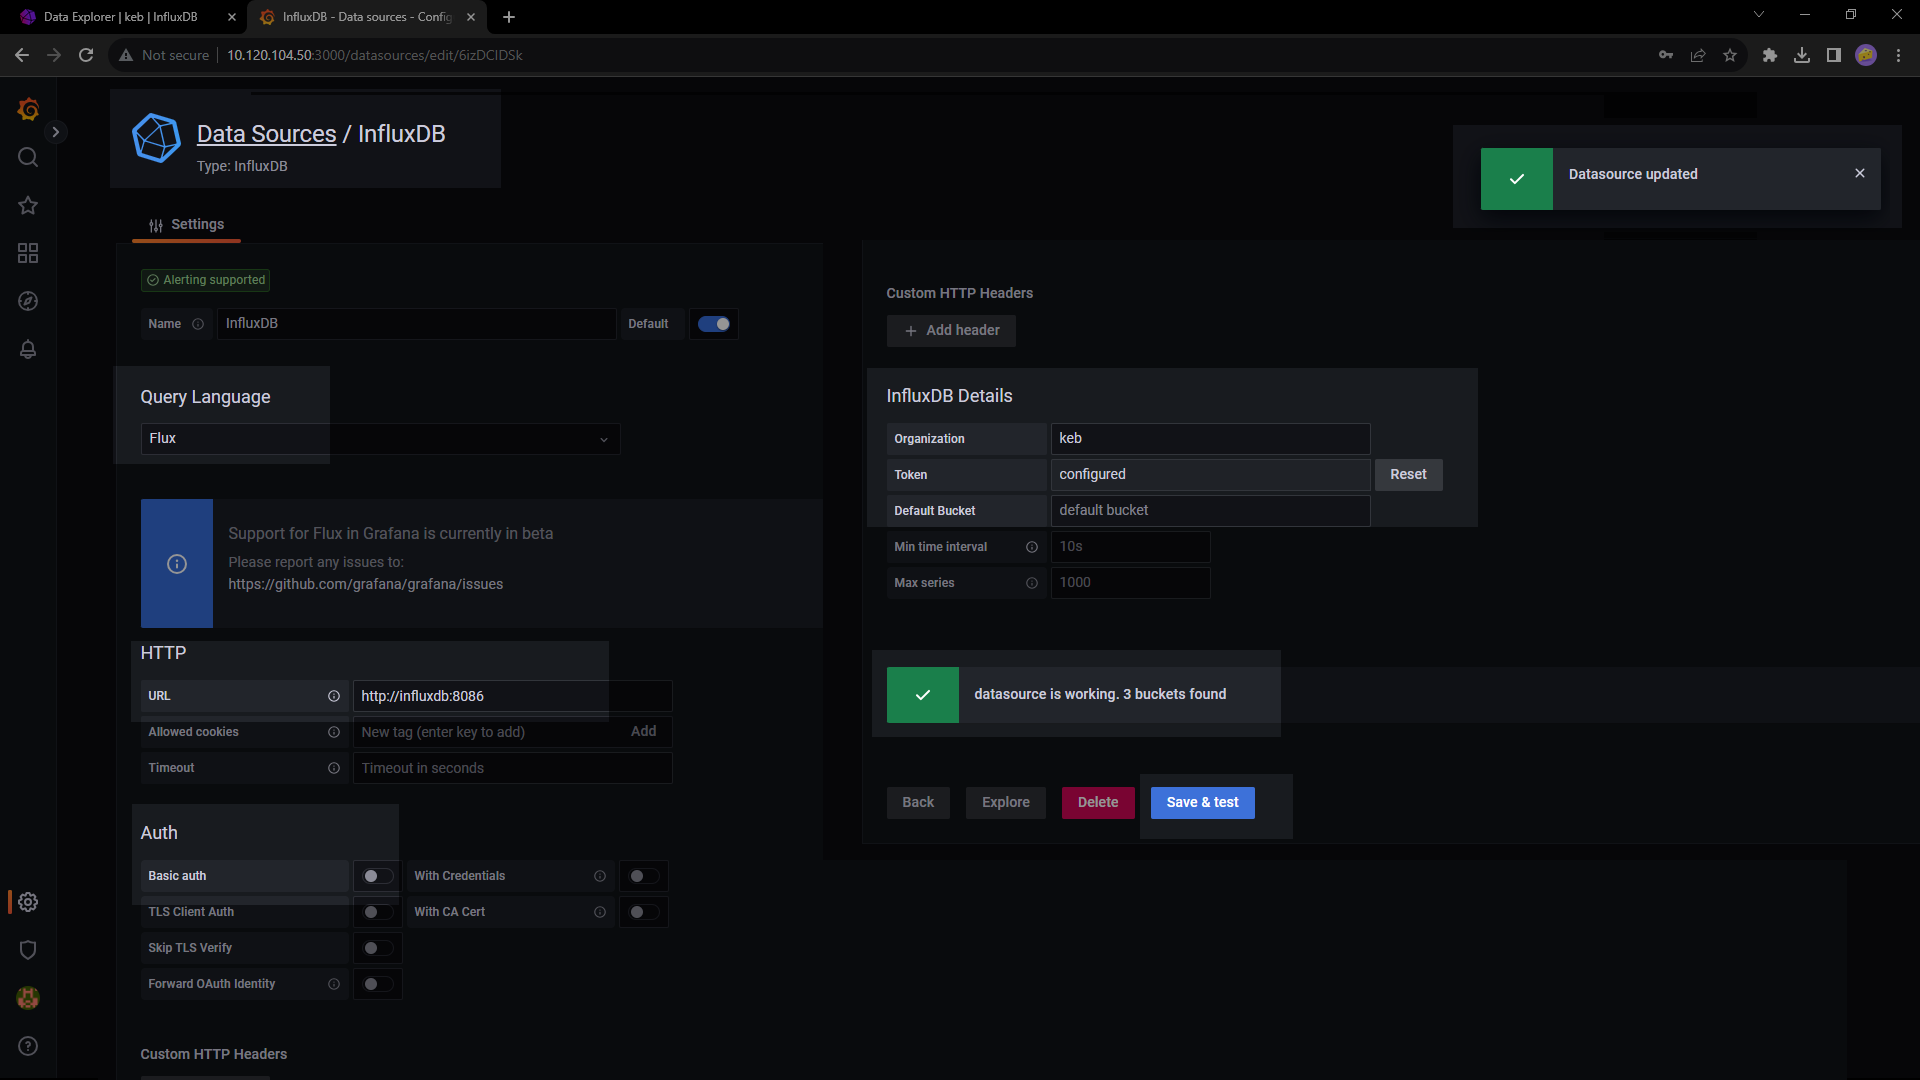
Configure Influx Source
 |
|
- Query Language:
Flux - URL:
http://influxdb:8086/ - Auth: De-select
Basic auth - "InfluxDB Details > Organization":
keb - "InfluxDB Details > Token":
my-token - Press "Save & Test"
⚠ Make sure you get the settings as shown in the screenshot and a ✔ green check at the end
Create a Dashboard
Create a Dashboard with Influx Data
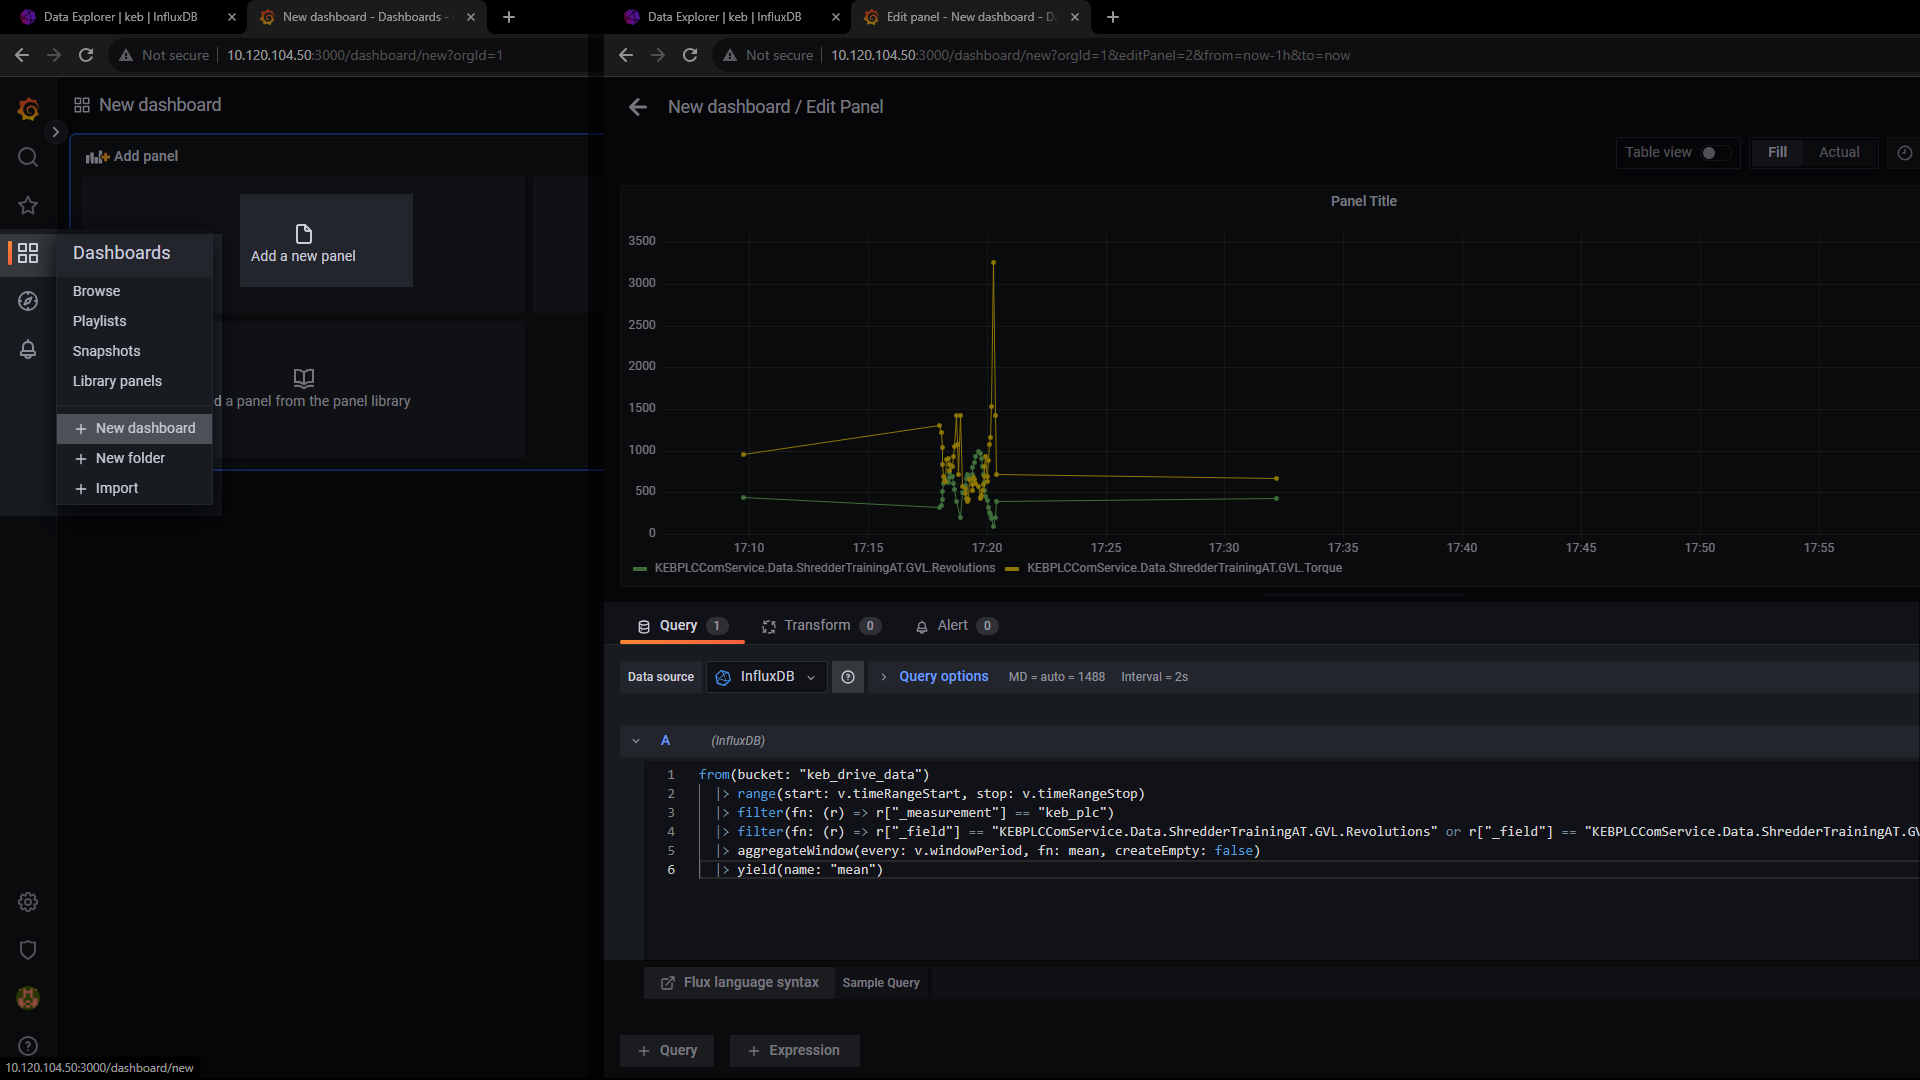
- Create a new dashboard from the menu on the left of the screen
- Click "Add Panel"
In the Edit Panel screen
- Paste the query from Influx into the text box under "A"
- Press "Apply" (upper right corner)
- Make sure your time range fits, e.g. "last 1 hour"
💾 Save your changes! -- Click on the floppy disk icon in the Dashboard
Share Dashboard

- Click the Share icon for the dashboard right next to the title
- Deselect "Lock time range"
- Copy the "Link URL"
Share Panel
- Click the Panel Title
- Select "Share"
- Deselect "Lock time range"
- Copy the "Link URL"
In HELIO
- Paste the URL into an Embedded Webview Page and/or an Embedded Webview inside a Widget on a Dashboard Page ➡ see next section
Embed in HELIO HMI
URL Example as copied from Grafana
http://<ip>:3000/d/hLnrqIDIk/new-dashboard?orgId=1 &from=now-1h &to=now &viewPanel=2 &kiosk &refresh=5s
http://<ip>:3000/d/hJnrqIDIk/new-dashboard?orgId=1&from=now-1h&to=now&viewPanel=2&kiosk&refresh=5s
Adapt URL
- To adapt the shown time range change the values for
fromandtoparameters in URL- Date+time is in ms, you may use relative times, e.g.
now.
- Date+time is in ms, you may use relative times, e.g.
- Add
kioskto the end of the URL to disable most of the Grafana UI. - Add
refresh=5sto keep the dashboard updated (specify the interval)
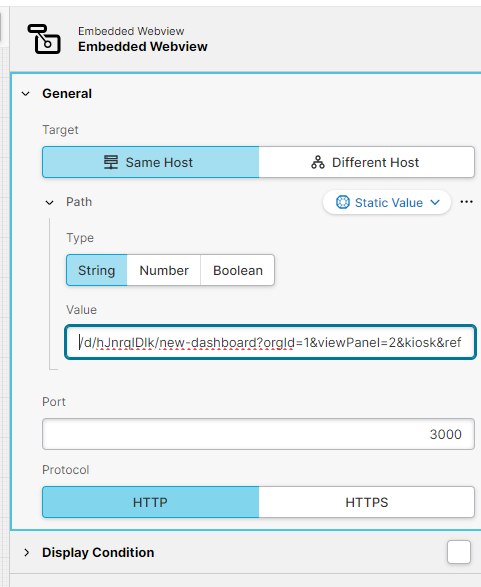
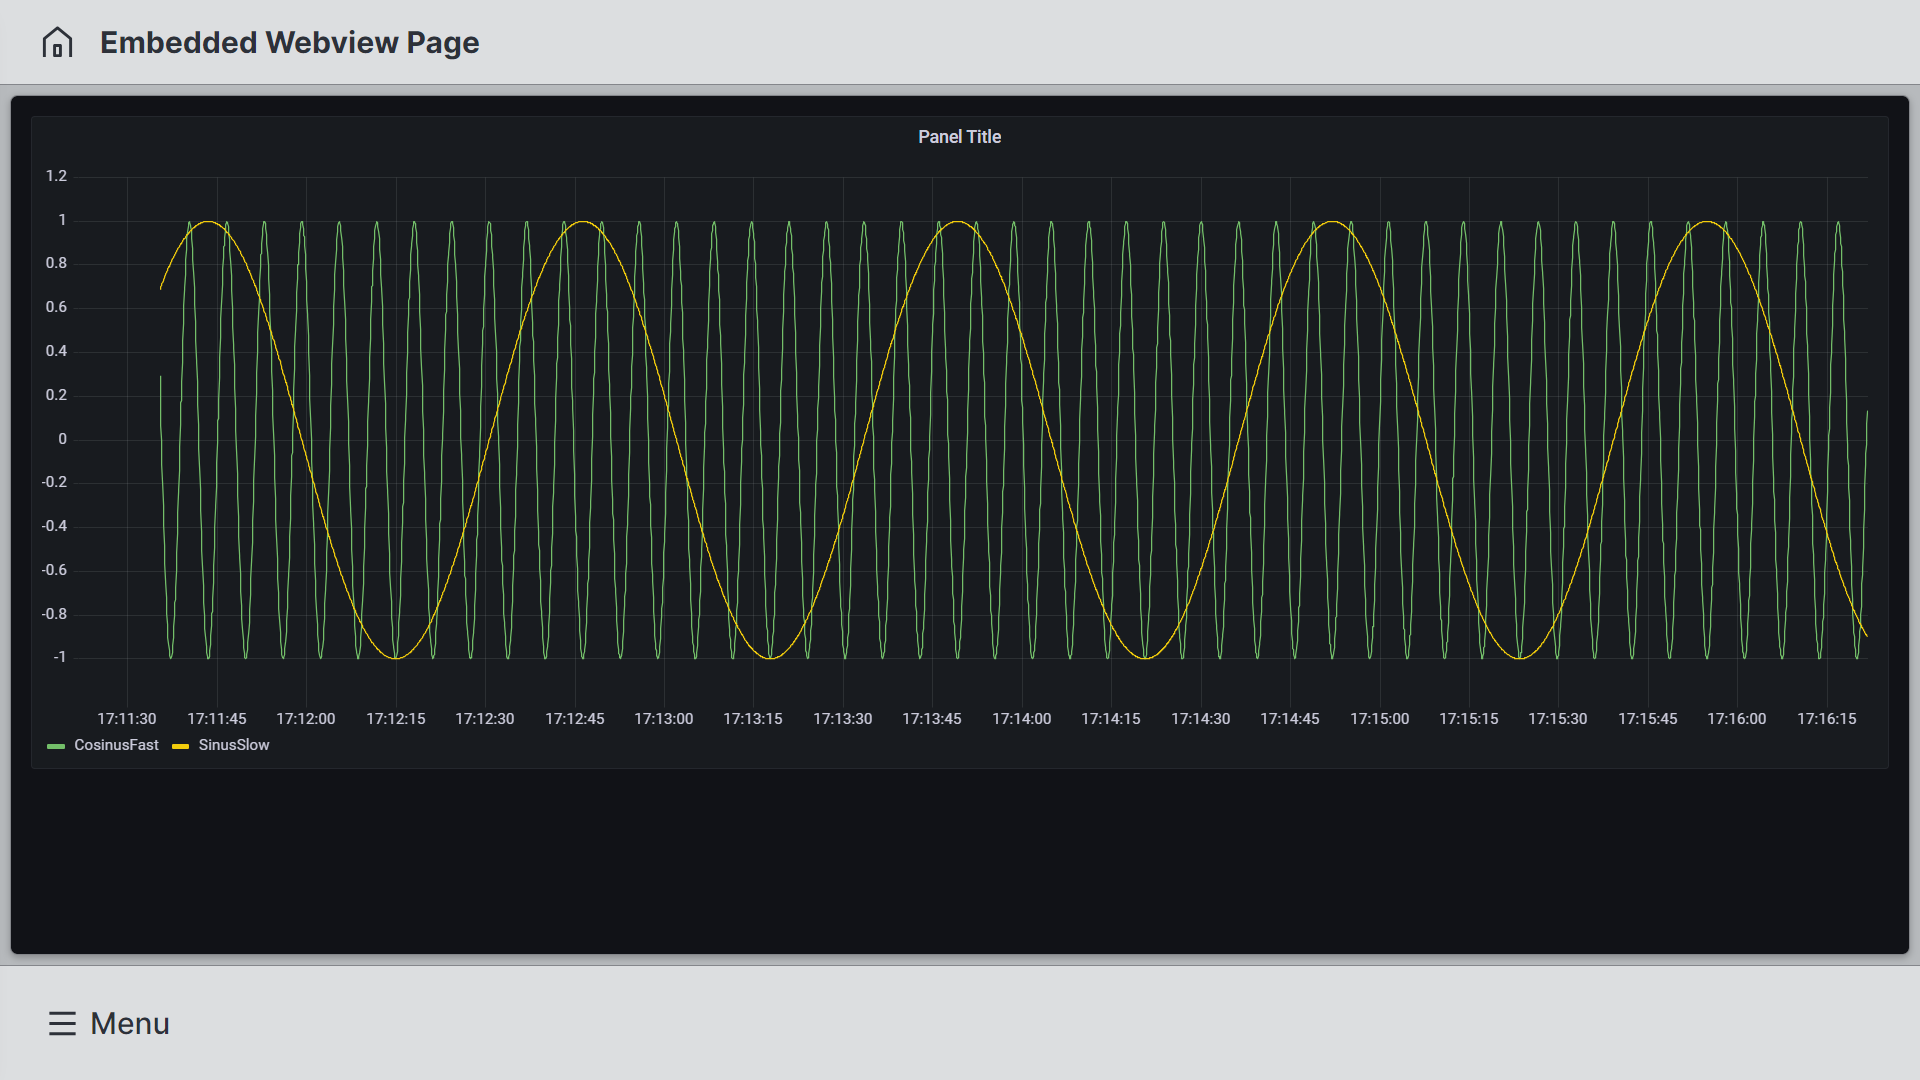
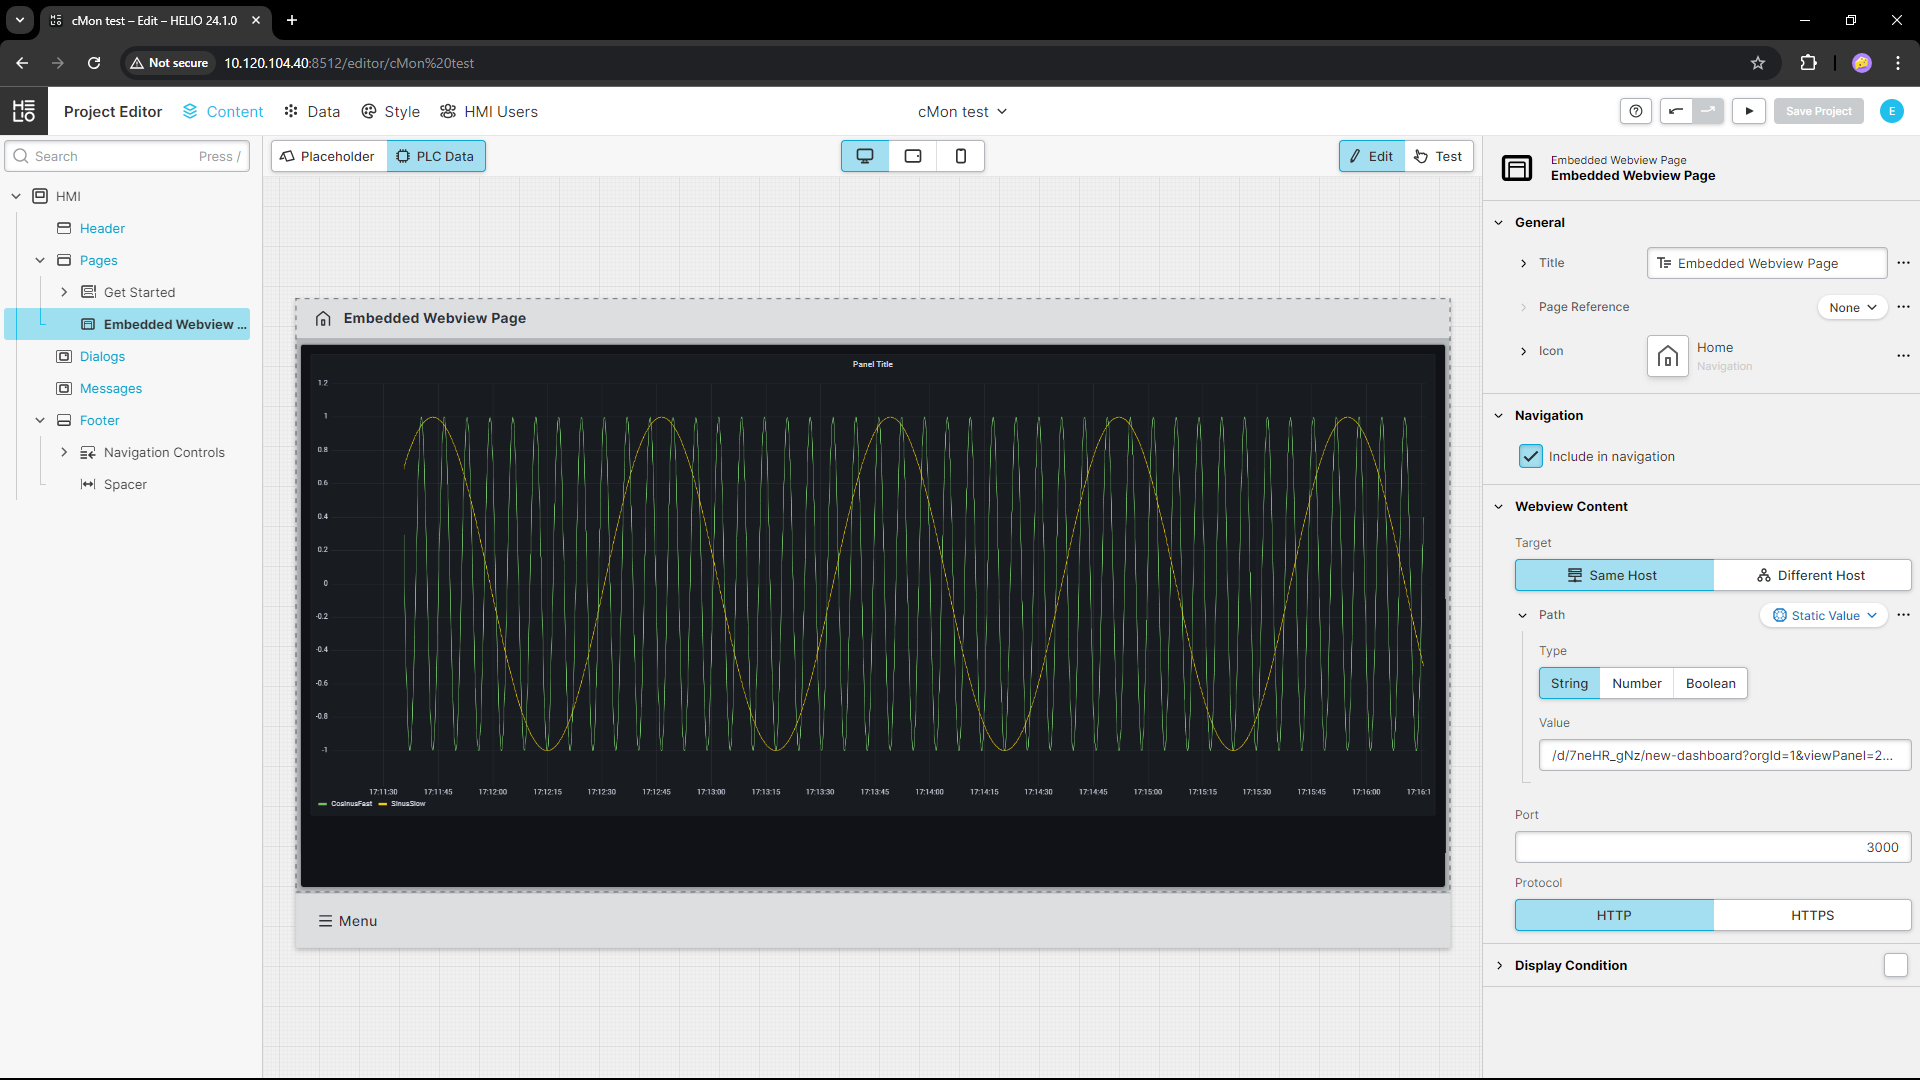
Use Embedded Webview (Page)
Insert the resulting URL into an Embedded Webview in HELIO
- First use the complete URL, then
- switch to "Same Host"

Result
Known Issues
- Cannot install Condition Monitoring on C6X1 Panels: The panel uses the same port as Grafana
:3000for the system settings